Viscosity Measurement of Ceramic Slurries with the Rotational Rheometer RheolabQC
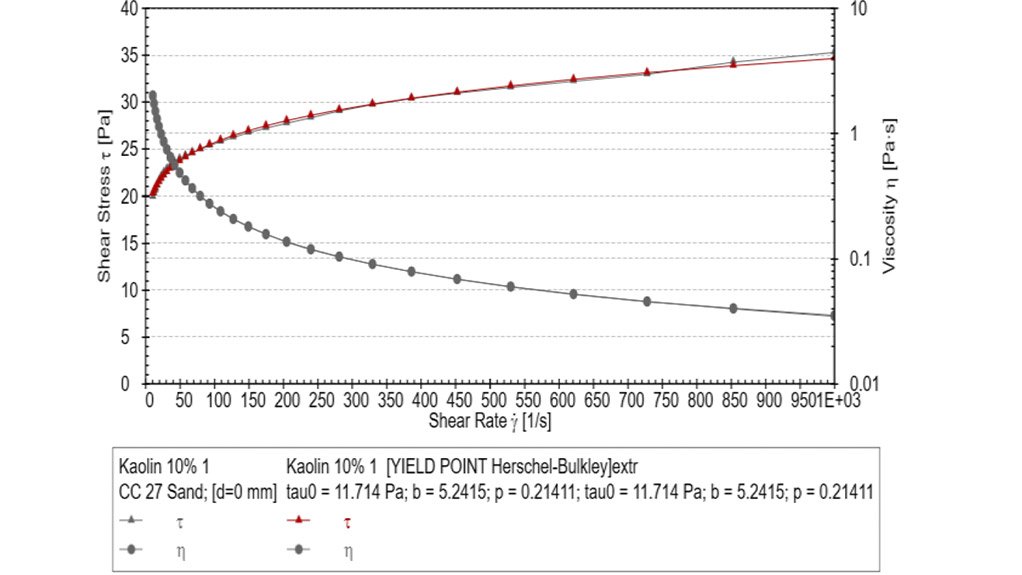
Flow and viscosity curve with curve fitting and the calculation of the yield point using the Herschel-Bulkley model. The analysis routine and automated measuring profile are part of the RheolabQC instrument and software package.


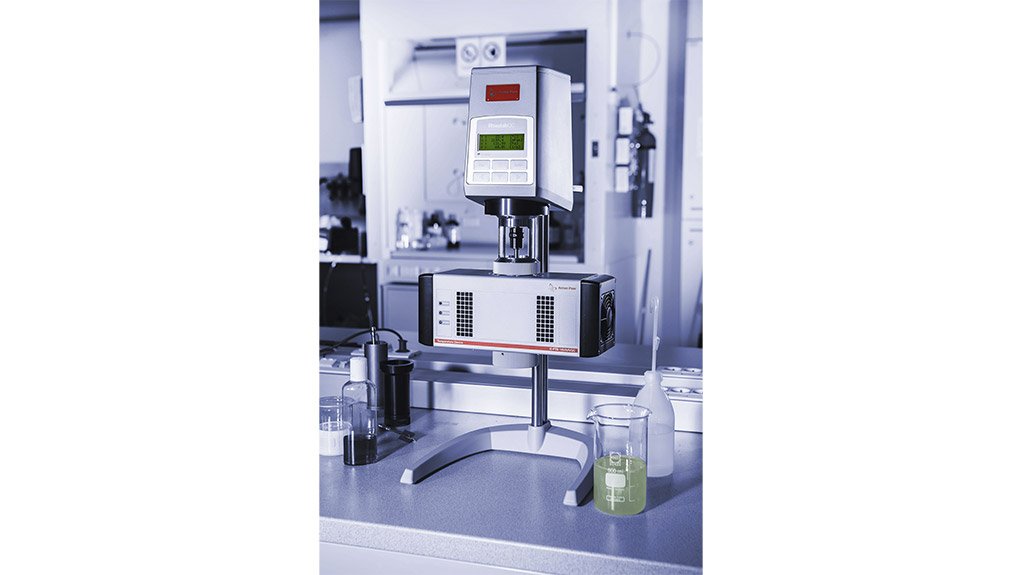
The Anton Paar RheolabQC makes rheological checks routine and easy. We demonstrate with the example of kaolin suspensions how rheological parameters such as the yield point and viscosity help to describe important transport and processing behaviors of slurries.
Introduction
The processing and transport characteristics of slurries are heavily dependent on their rheological properties. Knowledge of the rheological parameters is therefore essential, particularly when transporting a large amount of slurry. This report describes a measuring method for the rheological assessment of slurries. The flow curve is used to represent the pipe flow, the flow resistance and pressure difference.
Experimental Setup
Samples
Kaolin: Aluminum silicate hydrate Al4 (OH)8 [Si4O10]
- Kaolin (china clay) is a potassium silicate of the mineral kaolinite. It is created by the decomposition and transformation of silicate rocks. Pure kaolin is snow-white. When mixed with quartz or ice spar it is gray-yellow (crude kaolin, kaolin sand). Kaolin which has been created by the weathering of granite and ice spar can be found in many locations around the world.
- It is mined using wet-chemical flotation and subsequent cleaning. The main components of kaolin are SiO2 (35 %) and Al2O3 (46 % - 49 %). The pH value is approx. 5. The particle size is between 2 μm and 20 μm. The particle density is approx. 2.6 g/cm3
- The sample investigated for this report was a kaolin suspension with a volume concentration of 10% solids in water.
Test procedure
All measurements were performed with an Anton Paar RheolabQC rheometer with a sandblasted cylinder measuring system CC27 according to ISO 3219. The sandblasted surface reduces wall slipping effects. ISO 3219 describes the construction of the cylinder geometry and defines the ratio of measuring cup diameter to measuring bob diameter. This guarantees an industrial standard for shearing the sample in the measuring gap, independent of the measuring system size and manufacturer.
When measuring slurries, the following points must be taken into consideration:
- The measuring system CC27 can be used for particle sizes below 100 μm.
- If the average particle size is considerably higher than 100 μm, we recommend using a vane geometry with 4 vertical vanes like ST22/4V/40 in the CC27 measuring cup.
- The unique Peltier temperature device C-PTD180/AIR/QC enables quick and accurate temperature control for measurements in a range from 0 °C to 180 °C.
- The RheoCompass™ software can be used to apply defined temperature profiles during the measurement. This makes it easy to investigate the temperature-dependent behavior of the samples, e.g. in a temperature range of 5 °C to 40 °C, with a constant heating rate of 2 K/min and a constant shear rate of 100 s-1.
Measurement Setup in the Software
The test can be performed stand-alone at the instrument or software-controlled with the RheoCompass™ software. The measuring profile has one interval:
Results and Discussion
The viscosity function describes the flow behavior at different shear rates. If the flow is assumed to be laminar and stationary, the shear rate on the pipe wall (b) and the shear stress on the pipe wall (c) can be calculated using the Hagen-Poiseuille relation (a):

Description of the flow process starting from a state without any movement:
To pump or shear a slurry, the network forces in the structure have to be exceeded (Hooke’s elasticity law). In rheology, this initial ’static friction’ is often called the ’yield point’. A disproportionate amount of energy is required to overcome the yield point. This is illustrated in table 1:
A volumetric flow of 6.5 l/min of slurry in a one-meter pipe results in a pressure difference of Δp = 1663 Pa/m.
Increasing the volumetric flow by ten times, i.e. to 65 l/min slurry, results in Δp = 2137 Pa/m. This means an increase of only 28%.

The relationship between volumetric flow and pressure difference becomes clear if we observe the shear stress more closely (Figure 3). At low shear rates and low volumetric flow, the shear stress and pressure difference Δp in the pipe is already relatively high (Δp = 1663 Pa/m at 10 s-1). Increasing the volumetric flow Q of slurry in the pipe requires only a slight further increase of the pressure difference. This is due to the shear-thinning (pseudoplastic) behavior of the slurry, i.e. decreasing viscosity with increasing shear rate.
The flow properties at ’almost rest’, i.e. at the start of the pumping process or during leveling, can be determined at low shear rates. The yield point of 12 Pa was calculated using the Herschel-Bulkley (H.B.) model. This gives a pressure difference of Δp = 1000 Pa/m (Table 2).

Until the yield point is reached, the resistance and pressure in the pipe are increasing proportionally with no significant resulting flow output.
Better pump characteristics can be obtained by reducing the yield point. Yield points which are too high make it impossible to restart the pumping process. The slurry comes to a standstill in the pipe.
Producing a shear-thinning slurry the pump output can be increased without significantly increasing the energy required. The viscosity of the sample should greatly decrease with increasing volumetric flow.
The rheological properties can be influenced by varying the slurry composition, e.g. the volume concentration (amount of water), additives (solids, polymers, liquids), particle size and pumping temperature.
Figure 3: Flow and viscosity curve with curve fitting and the calculation of the yield point using the Herschel-Bulkley model. The analysis routine and automated measuring profile are part of the RheolabQC instrument and software package.
Summary:
It was shown that the rotational rheometer RheolabQC with the sandblasted cylinder measuring system CC27 according to ISO 3219 is very useful for the control of the pumping process and for the characterization of slurries. Besides measuring flow and viscosity curves, the yield point can also be calculated, e.g. using the Herschel-Bulkley model. Measuring the yield point and the viscosity function gives important information for a better understanding of how slurries flow in pipes. It also helps solving problems with slurries which are difficult to pump.
Find out more by contacting Anton Paar Southern Africa: +27 010 443 0590 / rick.vosloo@anton-paar.com
Article Enquiry
Email Article
Save Article
Feedback
To advertise email advertising@creamermedia.co.za or click here
Research Reports

Projects


Latest Multimedia


Latest News


Showroom

Roytec Global is an international company specializing in liquid / solid and mineral separation technologies for the Mining and Industrial sectors.
VISIT SHOWROOM
CSIR International Convention Centre (CSIR ICC) - the leading conference and events venue in Pretoria/Tshwane.
VISIT SHOWROOM


Press Office
Announcements
What's On
Subscribe to improve your user experience...
Option 1 (equivalent of R125 a month):
Receive a weekly copy of Creamer Media's Engineering News & Mining Weekly magazine
(print copy for those in South Africa and e-magazine for those outside of South Africa)
Receive daily email newsletters
Access to full search results
Access archive of magazine back copies
Access to Projects in Progress
Access to ONE Research Report of your choice in PDF format
Option 2 (equivalent of R375 a month):
All benefits from Option 1
PLUS
Access to Creamer Media's Research Channel Africa for ALL Research Reports, in PDF format, on various industrial and mining sectors
including Electricity; Water; Energy Transition; Hydrogen; Roads, Rail and Ports; Coal; Gold; Platinum; Battery Metals; etc.
Already a subscriber?
Forgotten your password?
Receive weekly copy of Creamer Media's Engineering News & Mining Weekly magazine (print copy for those in South Africa and e-magazine for those outside of South Africa)
➕
Recieve daily email newsletters
➕
Access to full search results
➕
Access archive of magazine back copies
➕
Access to Projects in Progress
➕
Access to ONE Research Report of your choice in PDF format
RESEARCH CHANNEL AFRICA
R4500 (equivalent of R375 a month)
SUBSCRIBEAll benefits from Option 1
➕
Access to Creamer Media's Research Channel Africa for ALL Research Reports on various industrial and mining sectors, in PDF format, including on:
Electricity
➕
Water
➕
Energy Transition
➕
Hydrogen
➕
Roads, Rail and Ports
➕
Coal
➕
Gold
➕
Platinum
➕
Battery Metals
➕
etc.
Receive all benefits from Option 1 or Option 2 delivered to numerous people at your company
➕
Multiple User names and Passwords for simultaneous log-ins
➕
Intranet integration access to all in your organisation