Renewables statistics point to slow response to South Africa’s power constraints


New statistics released by the Council for Scientific and Industrial Research (CSIR) Energy Centre show that South Africa added only 100 MW of additional utility scale renewable-energy capacity in 2019, despite supply-side constraints and an intensive period of load-shedding.
In fact, the report describes 2019 as one of the worst on record for load-shedding, with 1 359 GWh of rotational cuts implemented and with Eskom having taken the unprecedented step of declaring Stage 6 load-shedding, or 6 000 MW of simultaneous cuts, on December 9.
Compiled by Joanne Calitz and Dr Jarrad Wright, the report is based on data provided directly by Eskom.
The CSIR Energy Centre has used the opportunity to also embed a brief crowd-funding survey into the publication. Wright tells Engineering News that the survey seeks to assess whether stakeholders see crowd-funding as a feasible mechanism for funding bite size, yet burning, energy research.
“As is the case with typical well-known crowd-funding platforms, one tries to establish a minimum funding need but if one does not meet that minimum, the research question will not be answered via that platform.”
Regardless of the survey results, the CSIR Energy Centre would continue producing yearly statistics for utility scale solar photovoltaic (PV), wind and concentrated solar power (CSP) in South Africa but would like to generalise this periodically to include further analysis on other energy carriers and technologies.
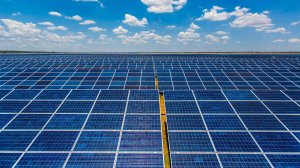
The 2019 report highlights that all of the new renewables capacity added last year arose in the form of CSP, which increased South Africa’s total operating CSP capacity to 500 MW.
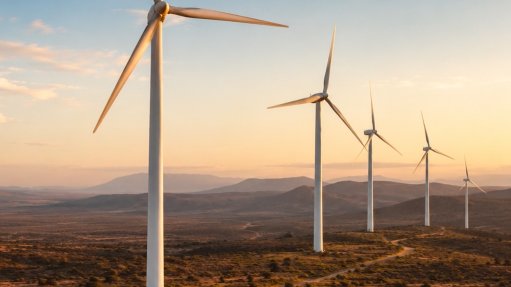
With no other renewables capacity added, total operating renewables capacity increased modestly to about 4 100 MW, with wind and utility scale solar PV capacity remaining static at 2 080 MW and 1 474 MW respectively.
The overall renewable energy contribution to the energy mix was 11.5 TWh, or 5%, with coal’s contribution remaining dominant at 84%, notwithstanding a slump in the performance of Eskom’s coal fleet during the year.
Nuclear contributed some 6% of total energy and the diesel-fuelled open-cycle gas turbines about 1%, while small hydro and imports provided the remaining balance of the energy.
ADEQUACY CONTRIBUTION
The maximum instantaneous contribution from wind, solar PV and CSP was nearly 14% of system demand on the afternoon of December 14, 2019, which is nevertheless modest relative to renewables penetration rates in many other territories.
Wind and solar PV production performance remained consistent when compared with previous years, with a capacity factor above 25% for solar PV and above 35% for wind.
Monthly contributions from wind, solar PV and CSP ranged between 784 GWh and 1 161 GWh, with a seasonal peak in the summer months.
The CSIR report also shows that, while the profile of solar PV consistently supports high daytime demand hours the wind fleet consistently supports into the late afternoon and early evening, particularly in the summer months.
Wind, solar PV and CSP also reduced high-demand hours, or hours when demand is more than 30 GW (system peak of 34.1 GW), from 734 hours to 291 hours last year, whilst peak demand, or the one hour of the year when the system peak occurs, was reduced by ~1.0 GW.
The system load for the year was 231 TWh, with a peak demand of 34.1 GW, representing a decline from the 234 TWh system load of 2018 and peak demand of 35.2 GW. Demand in 2020 is likely to fall by 5.9%, or 13 TWh, as a result of the Covid-19 lockdown.
Relative to total system demand, the residual demand after wind, solar PV and CSP is excluded helped shift residual base-demand needs from 24.6 GW to 23.4 GW and mid-merit needs from 5.1 GW to 4.8 GW. Peaking demand requirements increased from 4.4 GW to 4.8 GW.
Wright explains that this data is, thus, pointing to a lower need for base- and mid-merit capacity and an increased need for peaking, and increasingly flexible, capacity.
Article Enquiry
Email Article
Save Article
Feedback
To advertise email advertising@creamermedia.co.za or click here
Research Reports
Projects


Latest News

Showroom

Axiom Hydraulics is a trusted leader in South Africa’s hydraulic industry, delivering world-class components, systems, and engineering expertise...
VISIT SHOWROOM


Press Office
Announcements
What's On
Subscribe to improve your user experience...
Option 1 (equivalent of R125 a month):
Receive a weekly copy of Creamer Media's Engineering News & Mining Weekly magazine
(print copy for those in South Africa and e-magazine for those outside of South Africa)
Receive daily email newsletters
Access to full search results
Access archive of magazine back copies
Access to Projects in Progress
Access to ONE Research Report of your choice in PDF format
Option 2 (equivalent of R375 a month):
All benefits from Option 1
PLUS
Access to Creamer Media's Research Channel Africa for ALL Research Reports, in PDF format, on various industrial and mining sectors
including Electricity; Water; Energy Transition; Hydrogen; Roads, Rail and Ports; Coal; Gold; Platinum; Battery Metals; etc.
Already a subscriber?
Forgotten your password?
Receive weekly copy of Creamer Media's Engineering News & Mining Weekly magazine (print copy for those in South Africa and e-magazine for those outside of South Africa)
➕
Recieve daily email newsletters
➕
Access to full search results
➕
Access archive of magazine back copies
➕
Access to Projects in Progress
➕
Access to ONE Research Report of your choice in PDF format
RESEARCH CHANNEL AFRICA
R4500 (equivalent of R375 a month)
SUBSCRIBEAll benefits from Option 1
➕
Access to Creamer Media's Research Channel Africa for ALL Research Reports on various industrial and mining sectors, in PDF format, including on:
Electricity
➕
Water
➕
Energy Transition
➕
Hydrogen
➕
Roads, Rail and Ports
➕
Coal
➕
Gold
➕
Platinum
➕
Battery Metals
➕
etc.
Receive all benefits from Option 1 or Option 2 delivered to numerous people at your company
➕
Multiple User names and Passwords for simultaneous log-ins
➕
Intranet integration access to all in your organisation