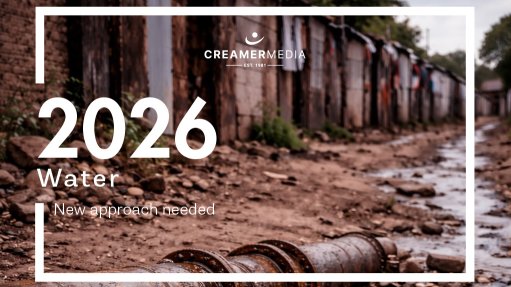
Country’s water quality deteriorates since 2014, nonrevenue water rockets - Blue, No, Green Drop reports


The latest full Blue and No Drop reports, along with the Green Drop progress assessment report, released by the Department of Water and Sanitation (DWS) on Tuesday, show the deterioration of South Africa’s drinking water quality, the state of water loss and nonrevenue water, and wastewater management performance, respectively.
The Blue and No Drop reports indicate that there has been a decline in drinking water quality and an increase in nonrevenue water since the last reports were issued in 2014. The Green Drop Progress Assessment Report meanwhile indicates a deterioration in the performance of municipal wastewater treatment systems.
The full Blue Drop report, assessing the quality of South Africa’s drinking water from July 1, 2021, to June 30, 2022, shows that while South Africa’s drinking water quality is generally good in the major metropolitan areas, there has been a regression in drinking water quality since 2014.
Of the 958 water supply systems (WSS) in each of the 144 water services authorities (WSAs) across South Africa, only 26, or 3%, scored more than 95% and qualified for the Blue Drop certification, compared with the 44 WSS, or 4%, which were awarded Blue Drop status in 2014.
According to the report, 277, or 29%, of systems located in 62 WSAs, are in a critical state, a deterioration from the 174 WSS’ in 33 WSAs that were found to be in a critical state in 2014.
Overall, 85% of drinking water systems were in an “average or better” infrastructure condition.
Of the 151 systems physically assessed, 3% were found to be in a critical infrastructural condition; 12% in a poor infrastructural condition; 49% in an average infrastructural condition; 31% in good condition; and 5% in an excellent condition.
This indicated that non-infrastructure factors such as a lack of skilled staff or a lack of proper process controls were as important as infrastructure condition as contributors to poor performance, said DWS director-general Dr Sean Phillips.
Unpacking the results, he pointed out that the assessment found that Gauteng, which has the highest percentage, at 62%, of drinking water systems with excellent or good performance, has the lowest shortfalls of qualified staff.
Comparatively, the Northern Cape - which has the highest percentage, at 87%, of drinking water systems with performance that was of a poor or critical level, a significant deterioration on the 48% recorded in 2014 - has the highest shortfalls of qualified staff.
“Based on water quality tests carried out by municipalities themselves during the 2021/22 municipal financial year, 54% of WSS achieved excellent or good microbiological water quality compliance and 46% achieved poor or bad microbiological water quality compliance,” he continued.
In 2014, 5% of water supply systems achieved poor or bad microbiological water quality compliance.
Further, in terms of chemical water quality compliance, 76% of systems achieved excellent or good, while 24% of systems were unacceptable, compared with 15% in 2014.
Phillips assured that the DWS had sent noncompliance letters to the municipalities with systems which scored poorly or badly in terms of drinking water quality in the 2023 Blue Drop report, requiring the municipalities to inform their residents should they still have poor or bad compliance.
During the audit period, 14 WSAs did not report water quality data – or provide any other evidence that they have been testing their water quality – to the DWS, with noncompliance notices issued to those municipalities, instructing them to issue advisory notices to their residents that their water might not be safe to drink if it has not been properly tested.
“Some of these WSAs indicated that they are in the process of appointing laboratories, others commenced with sampling, and others provided evidence of testing and achieving drinking water quality, and where necessary these WSAs did issue advisory notices,” Phillips commented.
Meanwhile, the No Drop report, which assesses the status of water losses and nonrevenue water, and the degree to which the drinking water distribution systems of municipalities supply water efficiently, shows that nonrevenue water has increased since 2014.
Of the total volume of water treated for municipal use, estimated at 4.4-billion cubic metres a year, nearly half (47%), at 2.1-billion cubic metres a year, is estimated to be nonrevenue water.
This is a significant increase on the 35% reported in the 2015 No Drop report. The international average for nonrevenue water is 30%.
Nonrevenue water is often caused by physical losses, such as water leaking out of pipes above or underground; poorly functioning or non-existent water meters; illegal connections; and poor billing and revenue collection.
The No Drop report found that four WSAs scored more than 90% and qualified for the No Drop certification, compared with the 44 WSAs awarded No Drop status in 2014.
Eight WSAs scored between 80% and 90%, while 64 WSAs scored below 30%.
Municipalities need to improve operation and maintenance of their infrastructure and repair leaks, while improving metering, billing, revenue collection and debtor management; improve pressure management; and engage in community education and awareness, besides others measures, to reduce nonrevenue water.
The Green Drop Progress Assessment, meanwhile, shows that 64% of wastewater treatment works (WWTWs) are at high or critical risk of discharging partially treated or untreated water into rivers and the environment.
The number of WWTWs in the high- and critical-risk categories have both increased since 2013, with 32% and 34% in the critical-risk and high-risk categories respectively in the 2023 update of the Green Drop Progress Assessment.
Only 9% of WWTWs were low-risk and 25% medium-risk, with none of the provinces having improved their WWTWs' risk ratings since the full Green Drop report was published in 2022.
In 2022, DWS released the full Green Drop report and the Blue and No Drop progress reports, and earlier this year, published the Green, Blue and No Drop “Watch Reports”, which were precursors to the full and interim reports.
Article Enquiry
Email Article
Save Article
Feedback
To advertise email advertising@creamermedia.co.za or click here
Research Reports
Projects

Latest Multimedia

Latest News

Showroom
Established in 1933, EKATO is the world leader in agitation technology, supplying agitators for processes and applications such as chemicals and...
VISIT SHOWROOM
Occupational health services, mobile clinics, wellness campaigns, aviation.
VISIT SHOWROOM


Press Office
Announcements
What's On
Subscribe to improve your user experience...
Option 1 (equivalent of R125 a month):
Receive a weekly copy of Creamer Media's Engineering News & Mining Weekly magazine
(print copy for those in South Africa and e-magazine for those outside of South Africa)
Receive daily email newsletters
Access to full search results
Access archive of magazine back copies
Access to Projects in Progress
Access to ONE Research Report of your choice in PDF format
Option 2 (equivalent of R375 a month):
All benefits from Option 1
PLUS
Access to Creamer Media's Research Channel Africa for ALL Research Reports, in PDF format, on various industrial and mining sectors
including Electricity; Water; Energy Transition; Hydrogen; Roads, Rail and Ports; Coal; Gold; Platinum; Battery Metals; etc.
Already a subscriber?
Forgotten your password?
Receive weekly copy of Creamer Media's Engineering News & Mining Weekly magazine (print copy for those in South Africa and e-magazine for those outside of South Africa)
➕
Recieve daily email newsletters
➕
Access to full search results
➕
Access archive of magazine back copies
➕
Access to Projects in Progress
➕
Access to ONE Research Report of your choice in PDF format
RESEARCH CHANNEL AFRICA
R4500 (equivalent of R375 a month)
SUBSCRIBEAll benefits from Option 1
➕
Access to Creamer Media's Research Channel Africa for ALL Research Reports on various industrial and mining sectors, in PDF format, including on:
Electricity
➕
Water
➕
Energy Transition
➕
Hydrogen
➕
Roads, Rail and Ports
➕
Coal
➕
Gold
➕
Platinum
➕
Battery Metals
➕
etc.
Receive all benefits from Option 1 or Option 2 delivered to numerous people at your company
➕
Multiple User names and Passwords for simultaneous log-ins
➕
Intranet integration access to all in your organisation