Global gold demand grew 8% in second quarter


JOHANNESBURG (miningweekly.com) – Global gold demand grew to 1 123 t during the second quarter, representing an increase of 8% year-on-year, the World Gold Council’s (WGC’s) most recent ‘Gold Demands Trends (GDT)’ report shows.
Published on Thursday, the GDT shows that continued central bank buying and sustained growth in gold-back exchange-traded funds (ETFs) were the key drivers of the increase in demand.
Overall, the first half of this year saw gold demand increase to 2 181.7 t, an increase of 8% compared with the first half of last year.
Over the last three months, WGC member and market relations director John Mulligan said one key driver of growth had been the search for stability in a time of heightened economic and geopolitical uncertainty.
In an interview with Mining Weekly Online, Mulligan referred to Black Rock’s global risk index, which indicated that geopolitical risks would have a material impact on markets over the next year, as would several other risks, including global trade tensions, European fragmentation, increased US/China tensions and the like.
“It’s a long list [of risks], but what they’re basically saying is that … geopolitical risk is something that has to be factored in when viewing the market and I think central banks are well aware of the need for safety and stability,” he elaborated.
With these risks expected to linger, Mulligan noted that, looking forward into the second half of this year, it would drive a number of future sources of gold demand.
Additionally, gold’s price increase, from about $1 350/t to over $1 400/t, during the second quarter of the year was said to also have had an impact on the period’s demand on both sides of the spectrum.
The price rise in some other currencies was even more pronounced. Among the factors driving this rally were expectations of lower interest rates and political uncertainty, with further support coming from strong central bank buying, the GDT reports states.
Central banks bought 224.4 t of gold during the quarter, taking the first half of this year’s buying to 374.1 t – the largest net first-half increase in global gold reserves in the council’s 19-year quarterly data series. In a continuation of recent trends, buying was spread across a diverse range of – largely emerging market – countries.
Holdings of gold-backed ETFs grew 67.2 t during the second quarter to a six-year high of 2 548 t on the back of continued geopolitical instability, dovish commentary on monetary policy from central banks, and the rallying gold price in June, which were cited as the main factors driving inflows into the sector.
July has, so far, seen additional purchases of 54 t, the majority of which came from the US, Mulligan said.
“Both strong European ETF purchasing, and then strong US purchasing implies that many of the prior mentioned risks, are now percolating through to the institutional potential investor,” he told Mining Weekly Online.
Mulligan further said that the higher ETF purchasing was “largely a reflection of safe-haven buying”, with central banks seeing gold more as a long-term stabilisation asset.
While gold is considered a source of safety, it isn’t necessarily driven purely by heightened risks.
“Undoubtedly, at the moment, the central bank buying, and the ETF buying, both reflect geopolitical tensions and also economic outlooks, where there is a need for stability and the need for some safe source of returns. Gold is currently looking to play that role”.
Meanwhile, a strong recovery in India’s jewellery market pushed demand in the second quarter up by 12% to 168.8 t. The recovery was mainly owing to a busy wedding season and healthy festival sales having boosted demand, before the June price rise brought it to a virtual standstill.
India’s growth drove modest improvement in the global jewellery total, the GDT notes, reflecting an increase of 2% year-on-year, to 531.7 t.
“Looking forward, I think we’re a little more muted in our immediate outlook for the Indian market,” Mulligan commented.
Both the June price rise and the surprise announcement of an additional 2.5% import and customers tax have dampened some demand, with the latter dampening the confidence of some of the market players and some of the jewellers, fabricators and the retailers.
“For the short term, we’re a little more muted than what we were expecting for the third quarter [and while] we don’t think there is any long-term infrastructural implications, we do think that, being realistic, quarter three may be a little quieter,” he added.
Overall, the second quarter was “a strong quarter” for India, not only in terms of jewellery but also for investment demand, which similarly, was up by 13%.
Mulligan further noted that bar and coin buying was often a reflection of the incentives from the festivals in India, which were usually seen as auspicious times in which to buy gold. As a result of the June price rise having brought demand to a “virtual standstill”, bar and coin investment in the second quarter sank by 12% to 218.6 t.
Combined with the soft first-quarter number, this took the first half’s total to a ten-year low of 476.9 t, with a 29% year-on-year drop in China having accounted for much of the global second-quarter decline.
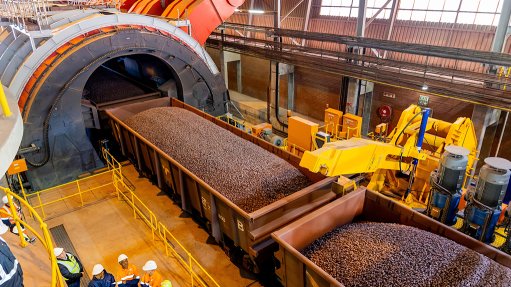
Moreover, gold supply grew 6% in the second quarter to 1 186.7 t, comprising a record 882.6 t for the quarter’s gold mine production and a 9% jump in recycling to 314.6 t – boosted by the sharp June gold price rally – having led the growth in supply.
Looking at the whole of the first half of 2019, supply reached 2 323.9 t – the highest level since 2016.
Other key findings in the GDT include overall gold demand standing at 1 123 t during the second quarter, an 8% increase year-on-year, while total consumer demand was down at 750.3 t, compared with 769 t in the same period last year.
Total investment demand remained relatively flat, growing 1% to 285.8 t, while global jewellery demand increased by 2% to 531.7 t during the quarter.
Central bank demand increased by 47% to 224.4 t, while demand in the technology sector decreased by 3% to 81.1 t. This was the third consecutive quarter of falling demand, owing to a range of challenges in the electronics sector, including the ongoing trade dispute between China and the US.
However, the WGC says there are signs of recovery and it expects declines to continue to slow throughout the second half of the year.
In the GDT report, the council states that the electronics sector saw weakness across key sectors, with printed circuit board demand being the only area of growth during the period.
Other technology applications registered minor decreases, but the ongoing decline in dental demand continued with a 7% year-on-year decline.
Total supply was up at 1 186.7 t, from 1 121.3 t in the same period last year, with mine production up by 2% year-on-year, reaching 882.6 t, making it the highest second quarter on the WGC’s record.
“The current outlook in terms of market conditions for gold mining are still strong and, while production levels aren’t a reflection of those market conditions, it should at least allow gold miners to operate in a fairly healthy environment,” Mulligan told Mining Weekly Online.
Unfortunately, one of the “negative stories” in gold mine production is that South African production will be down, he noted, adding that this was largely because South Africa’s gold mining industry had been considerably disrupted over quite some time because of industrial action at Sibanye-Stillwater’s operations.
South African production fell by 12% year-on-year during the quarter as a result of the industrial action, which began in November 2018 and only drew to a close at the end of April.
The global gold mining market was doing relatively well, in comparison, Mulligan said.
Weaker currencies, meanwhile, helped to improve miners’ margins by pushing non-US dollar costs down, boosting miners’ coffers in key mining nations such as South Africa, China, Australia, Russia and Ghana, the GDT report notes.
Gold recycling was up 9% at 314.6 t, compared with 289.8 t in the second quarter of 2018.
Article Enquiry
Email Article
Save Article
Feedback
To advertise email advertising@creamermedia.co.za or click here
Research Reports
Projects

Latest Multimedia

Latest News

Showroom
Sweet-Orr, established in 1871, is a global leader in superior protective workwear, known for quality, innovation, and performance.
VISIT SHOWROOM
ATI systems comprises five divisions: electrical assemblies, drives and controls, feedback sensors, enclosures, and strip guiding.
VISIT SHOWROOM


Announcements
What's On
Subscribe to improve your user experience...
Option 1 (equivalent of R125 a month):
Receive a weekly copy of Creamer Media's Engineering News & Mining Weekly magazine
(print copy for those in South Africa and e-magazine for those outside of South Africa)
Receive daily email newsletters
Access to full search results
Access archive of magazine back copies
Access to Projects in Progress
Access to ONE Research Report of your choice in PDF format
Option 2 (equivalent of R375 a month):
All benefits from Option 1
PLUS
Access to Creamer Media's Research Channel Africa for ALL Research Reports, in PDF format, on various industrial and mining sectors
including Electricity; Water; Energy Transition; Hydrogen; Roads, Rail and Ports; Coal; Gold; Platinum; Battery Metals; etc.
Already a subscriber?
Forgotten your password?
Receive weekly copy of Creamer Media's Engineering News & Mining Weekly magazine (print copy for those in South Africa and e-magazine for those outside of South Africa)
➕
Recieve daily email newsletters
➕
Access to full search results
➕
Access archive of magazine back copies
➕
Access to Projects in Progress
➕
Access to ONE Research Report of your choice in PDF format
RESEARCH CHANNEL AFRICA
R4500 (equivalent of R375 a month)
SUBSCRIBEAll benefits from Option 1
➕
Access to Creamer Media's Research Channel Africa for ALL Research Reports on various industrial and mining sectors, in PDF format, including on:
Electricity
➕
Water
➕
Energy Transition
➕
Hydrogen
➕
Roads, Rail and Ports
➕
Coal
➕
Gold
➕
Platinum
➕
Battery Metals
➕
etc.
Receive all benefits from Option 1 or Option 2 delivered to numerous people at your company
➕
Multiple User names and Passwords for simultaneous log-ins
➕
Intranet integration access to all in your organisation