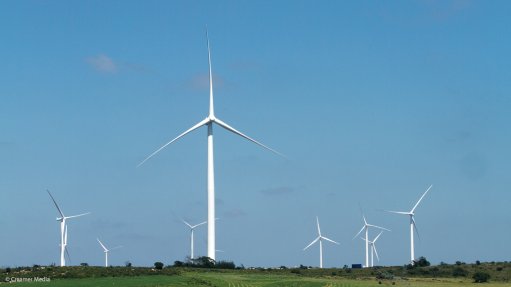
Photo by: Duane Daws
By Johannes Horstmann
In a long awaited announcement, which attracted intense media attention, the South African Department of Energy (DoE) recently published the list of preferred bidders for round 4 of the Renewable Energy Independent Power Producer Procurement Programme (REIPPPP) – 415 MW of solar photovoltaic (PV) and 676 MW of wind projects will now soon be constructed.
Favourably to the economy, electricity prices have again dropped significantly. Solar PV generated electricity will cost on average R786/MWh, 29% cheaper in real terms than round 3 projects. Similarly, electricity generated by wind is priced at R619/MWh, a drop of about 25% in real terms. This followed the trend of rounds 2 and 3 where prices already fell by between 30% and 40% in each round for both technologies.
A hot topic for the market is now: how far can this go? How will bidders price their projects in the next tendering rounds 5 and 6?
From a pure time trend perspective, it seems as if PV prices could decrease further by some 19% and wind by 8% in real terms (see graphics above). Those tariffs would follow a nice statistical learning curve. But can the market deliver these price cuts?
Developers and financiers will review their projects with regards to development cost, engineering procurment and construction cost, cost of capital, operations and maintenance expenditure and potential energy yields on a case-by-case basis.
However, the market is maturing and is becoming more and more competitive. The DoE received 77 bids in August 2014 and only awarded preferred bidder status to 13.
From market responses, transaction costs and return on equity have decreased and are starting to resemble international benchmarks more closely, as healthy competition is still inducing development efficiencies. Favourable project development locations are also becoming scarcer with incumbent projects having secured the best areas, limiting the potential to improve energy yields further. In addition, grid connection is now becoming more difficult, creating cost pressure for developers.
International learning rates (the level of cost reduction when doubling the capacity), estimated and published by institutions such as the International Energy Agency or the International Renewable Energy Agency, are currently between 18% and 22% for solar PV and between 5% and 9% for onshore wind.
These global trends and the capacities for the next bid windows could translate to levelling out bidding prices. Solar PV tariffs could decrease by only 6%, which would just cancel out inflation effects.
Notwithstanding the above, this aligns with the Integrated Resource Plan update report for crystalline and thin film PV module costs (7% and 6% decrease per annum respectively). Wind prices could fall by 3% in real terms or a slight first-time rise in nominal terms.
It is also worth benchmarking the South African practice with international markets.
The Dubai Electricity and Water Authority announced in January this year a new world record for solar PV. It awarded a consortium, led by Saudi Arabia’s ACWA Power, a 200 MW project based in the United Arab Emirates for not-yet-seen 5.84c/kWh (US cents).
Notwithstanding, the consortium has an advantage over the developers in South Africa – financing cost. The availability of a 27-year tenure for a loan of $344-million and a 4% interest rate are the biggest factors for the low bid.
To illustrate this, with a shorter tenure of 15 years, higher interest rates of 10% and amid higher inflation of 6% (as seen in the South African market), indicative modelling shows that ACWA Power would have needed to bid with 7.2 c/kWh (US cents). This is interesting, because this is exactly the average PV price of the latest round 4 projects, in 2014 US dollar terms.
In conclusion, based on the above observations, South Africa may now have reached global best-practice benchmarks and future prices may follow closer to those internationally observed market movements.
These international learning rates may be much less than the cost reductions experienced in the past few years. Developers and financiers will follow these trends with great interest to inform their own future bidding strategies.
This projected change in trends should not be discouraging but rather be seen as a reflection of the positive development of the renewable energy programme in South Africa, and the positive impact the REIPPPP is having on the South African economy as a whole.
A strong regulatory environment for renewables has led to this market confidence that increased competition and drew investors and project development companies to South Africa. It shows the achieved efficiency of the IPP programme and provides confidence for the prospects of new IPP programmes for coal and gas that are currently being implemented.
Horstmann is a Transaction Adviser at Arup Cape Town