Photo by: CSIR
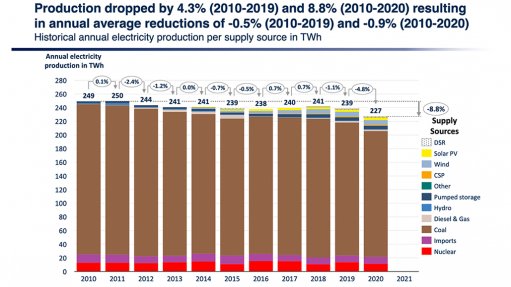
A new Council for Scientific and Industrial Research (CSIR) report offers a sobering picture of declining electricity system production and demand between 2010 and 2020 – a trend that was amplified further during Covid-hit 2020, when demand slumped by a sharp 5.1%, or 11.8 TWh, to a decade low level of 227 TWh.
Titled ‘Statistics of utility-scale power generation in South Africa in 2020’, the report has been compiled by the CSIR Energy Centre’s Joanne Calitz and Dr Jarrad Wright.
It shows that system demand has been falling for more than a decade, declining by 8.8% from 249 TWh in 2010 to 227 TWh last year, a 0.9% annual average reduction.
Excluding 2020, the reduction from 249 TWh in 2010 to 239 TWh in 2019 represents a 4% decline overall and an average decline of 0.5% a year.
The report also underlines the ongoing decline in the performance of Eskom’s coal fleet, which was the main contributor to another intense year of load-shedding, with 859 hours, or 9.8% of the year, affected by rotational power cuts, which resumed again on March 10.
The average energy availability factor (EAF) of the Eskom coal fleet slumped to 65%, from 66.9% in 2019 and 71.9% in 2018.
At 20.9%, unplanned outages were the biggest contributor to the lower EAF.
Despite this poor performance, coal continued to dominate the South African energy mix during pandemic-afflicted 2020. However, the report also shows that electricity produced from variable renewable energy sources surpassed nuclear for the first time ever last year.
More than 83% of system demand of 227 TWh, which included pumping load, was met using coal-fired power generation, which contributed 184.4 TWh.
Nuclear energy contributed 5.2%, or 11.5 TWh, while the 5 GW variable renewable energy fleet of solar photovoltaic (PV), wind and concentrated solar power (CSP) contributed 5.6%, or 12.4 TWh. Once hydropower is included, renewables contributed 10.5%, or 23.1 TWh.
By the end of 2020, the monthly wind, solar PV and CSP production combined varied between 784 GWh and 1 161 GWh, with the maximum daily total energy from solar PV, wind and CSP combined being 59 GWh on 1 December last year.
The maximum instantaneous penetration level from variable renewable energy was 16% of system demand and occurred on 27 December.