Global silver output falls 4.1% in 2017, as industrial demand ramps up – GFMS
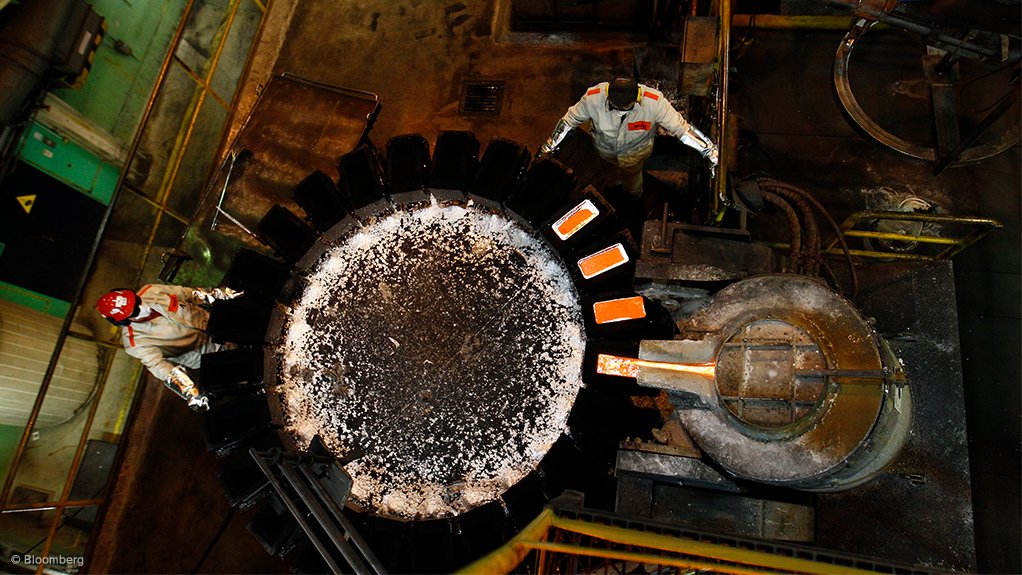
VANCOUVER (miningweekly.com) – A new survey by the GFMS team at Thomson Reuters has found that global silver output had fallen 4.1% in 2017 to 852.1-million ounces.
Prepared by GFMS, the report found that total physical demand of 1.02-billion ounces was 25% lower year-on-year, signalling that the tightening of the supply/demand balance contributed to a physical deficit of 26-million ounces in 2017 – the smallest of five consecutive annual deficits.
GFMS said a series of supply disruptions across the Americas, as well as the concerning large drop from the primary silver and gold sectors were to blame for the lower output, where production fell by a combined 29.4-million ounces, the twenty-eighth annual edition of the ‘World Silver Survey’ for The Silver Institute has found.
Of the key producing countries, Peru and China registered subtle dips, followed by more acute losses in Australia and Argentina. Offsetting those losses was higher output from Mexico, which was, once again, the world’s top silver producing country, lagged by Peru, China, Russia and Chile.
Supply from primary silver mines fell 9% over the 12-month period to 852.1-million ounces, contributing 28% of total mine supply. The lead/zinc sector contributed 36% of by-product output, followed by copper at 23% and gold at 12%, the survey has found.
Silver scrap supply fell slightly to 138.1-million ounces, from 139.7-million in 2016, marking its sixth successive yearly decline, the report noted. Lower scrap flows from Asia, mainly China, driven by a lack of incentives from both suppliers and consumers to recycle their valuables, is mainly responsible for the fall. Supply from the western world was marginally higher, driven by increased volumes from the US and Europe.
According to GFMS data, above-ground stocks rose 3% last year. Of the four exchanges that report silver stocks, three – Comex in the US, the Shanghai Futures Exchange and the Shanghai Gold Exchange, in China – saw total silver inventory growth of 2% in 2017. In contrast, silver inventories held at Tokyo Commodity Exchange declined “dramatically” by 98%, driven by strong industrial demand in Japan.
GFMS reports that government sales of silver were once again absent from the silver market in 2017. Another finding in the supply category, the delta-adjusted hedge book inched higher by 1.4-million ounces, ending last year at 21.5-million ounces of grey metal.
INDUSTRIAL GROWTH
GFMS noted that industrial demand for silver, fuelled by record 19% growth in photovoltaic demand, was thought to be the result of a 24% increase in global solar panel installations.
Brazing rose in 2017 for the first time since 2013. This was driven by a stronger global economy, which led to healthy demand from the semi-conductor market, resulting in greater silver offtake in electrical and electronics applications, as well as brazing alloys and solders, the report noted.
The jewellery and silverware sectors also experienced noteworthy gains in 2017. On the supply side, global mine supply fell for the second consecutive year, following an uninterrupted streak of 13 yearly increases before 2016. Silver scrap supply, which has been in retreat since 2012, again registered a loss.
Global silver industrial fabrication demand returned to growth in 2017, increasing 4% to 599-million ounces.
The surge in electronics, most notably in semi-conductor fabrication demand, led to the electrical and electronics segments delivering the first annual increase in offtake in this category since 2010, with 242.9-million ounces consumed last year.
In 2017, the average silver price fell 0.5% to $17.05/oz, with prices trading in a $15.22/oz to $18.56/oz range. Notwithstanding, last year’s average silver price still reflects an 8.7% increase over the average posted just two years ago of $15.68/oz.
GFMS data showed that identifiable investment, which comprises net physical bar investment, coins and medals purchased, and net changes to exchange-traded product (ETP) holdings, reached 153.5-million ounces in 2017, a massive 40% decline from 2016.
GFMS said this was mainly owing to a 35% decline in coin and medal fabrication, led by lower demand in the US, Canada and China. Physical bar demand slipped by 16% last year.
In contrast, total global ETP holdings increased by 2.4-million ounces to finish 2017 at 669.8-million ounces, the report noted. In value terms, total ETP holdings increased 4% to $11.3-billion, as the silver price advanced throughout the year.
Comments
Press Office
Announcements
What's On
Subscribe to improve your user experience...
Option 1 (equivalent of R125 a month):
Receive a weekly copy of Creamer Media's Engineering News & Mining Weekly magazine
(print copy for those in South Africa and e-magazine for those outside of South Africa)
Receive daily email newsletters
Access to full search results
Access archive of magazine back copies
Access to Projects in Progress
Access to ONE Research Report of your choice in PDF format
Option 2 (equivalent of R375 a month):
All benefits from Option 1
PLUS
Access to Creamer Media's Research Channel Africa for ALL Research Reports, in PDF format, on various industrial and mining sectors
including Electricity; Water; Energy Transition; Hydrogen; Roads, Rail and Ports; Coal; Gold; Platinum; Battery Metals; etc.
Already a subscriber?
Forgotten your password?
Receive weekly copy of Creamer Media's Engineering News & Mining Weekly magazine (print copy for those in South Africa and e-magazine for those outside of South Africa)
➕
Recieve daily email newsletters
➕
Access to full search results
➕
Access archive of magazine back copies
➕
Access to Projects in Progress
➕
Access to ONE Research Report of your choice in PDF format
RESEARCH CHANNEL AFRICA
R4500 (equivalent of R375 a month)
SUBSCRIBEAll benefits from Option 1
➕
Access to Creamer Media's Research Channel Africa for ALL Research Reports on various industrial and mining sectors, in PDF format, including on:
Electricity
➕
Water
➕
Energy Transition
➕
Hydrogen
➕
Roads, Rail and Ports
➕
Coal
➕
Gold
➕
Platinum
➕
Battery Metals
➕
etc.
Receive all benefits from Option 1 or Option 2 delivered to numerous people at your company
➕
Multiple User names and Passwords for simultaneous log-ins
➕
Intranet integration access to all in your organisation


