Fortinet Reports First Quarter 2016 Financial Results


This article has been supplied as a media statement and is not written by Creamer Media. It may be available only for a limited time on this website.
Fortinet’s Security Fabric Offerings and Strong Execution Drive Revenue Growth of 34% Year Over Year
- Billings of $330.5 million, up 30% year over year1
- Revenue of $284.6 million, up 34% year over year
- Non-GAAP diluted net income per share of $0.121
- Cash flow from operations of $100.6 million
- Free cash flow of $70.6 million1
- Cash, cash equivalents and investments of $1.19 billion
- Deferred revenue of $837.2 million, up 39% year over year
Fortinet® (NASDAQ: FTNT), a global leader in high performance cyber security solutions, today announced financial results for the first quarter ended March 31, 2016.
“During the first quarter, Fortinet executed very well and outperformed across all key metrics,” said Ken Xie, founder, chairman and chief executive officer. “The increasing complexity of the IT security landscape is driving customer adoption of broad, integrated platforms, which has been our vision from the company’s inception. Fortinet’s Security Fabric is a strategic asset, since it allows customers to protect and gain intelligence on all points in the network - from IoT to cloud - through a unified operating system and management platform. This, along with recently announced products like our FortiGate-6000E Series of high-performance systems, strengthens our competitive position, expands our market opportunity, and helps to drive continued growth in 2016 and beyond.”
Financial Highlights for the First Quarter of 2016
- Billings1: Total billings were $330.5 million for the first quarter of 2016, an increase of 30% compared to $254.3 million in the same quarter of 2015.
- Revenue: Total revenue was $284.6 million for the first quarter of 2016, an increase of 34% compared to $212.9 million in the same quarter of 2015. Within total revenue, product revenue was $124.6 million, an increase of 28% compared to $97.5 million in the same quarter of 2015. Service revenue was $160.0 million, an increase of 39% compared to $115.4 million in the same quarter of 2015.
- Deferred Revenue: Total deferred revenue was $837.2 million as of March 31, 2016, an increase of $45.9 million compared to $791.3 million as of December 31, 2015.
- Cash and Cash Flow2: As of March 31, 2016, cash, cash equivalents and investments were $1.19 billion, compared to $1.16 billion as of December 31, 2015. In the first quarter of 2016, cash flow from operations was $100.6 million compared to $64.6 million in the same quarter of 2015. Free cash flow1 was $70.6 million during the first quarter of 2016 compared to $59.7 million in the same quarter of 2015.
- GAAP Operating Income or Loss: GAAP operating loss was $5.7 million for the first quarter of 2016, representing a GAAP operating margin of -2%. GAAP operating income was $0.9 million for the same quarter of 2015, representing a GAAP operating margin of 0.4%.
- Non-GAAP Operating Income1: Non-GAAP operating income was $30.1 million for the first quarter of 2016, representing a non-GAAP operating margin of 11%. Non-GAAP operating income was $20.1 million for the same quarter of 2015, representing a non-GAAP operating margin of 9%.
- GAAP Net Income or Loss and Diluted Net Income or Loss Per Share: GAAP net loss was $3.4 million for the first quarter of 2016, compared to GAAP net income of $1.6 million for the same quarter of 2015. GAAP diluted net loss per share was $0.02 for the first quarter of 2016, compared to GAAP diluted net income per share of $0.01 for the same quarter of 2015.
- Non-GAAP Net Income and Diluted Net Income Per Share1: Non-GAAP net income was $20.1 million for the first quarter of 2016, compared to non-GAAP net income of $13.5 million for the same quarter of 2015. Non-GAAP diluted net income per share was $0.12 for the first quarter of 2016, compared to $0.08 for the same quarter of 2015.
A reconciliation of GAAP to non-GAAP financial measures has been provided in the financial statement tables included in this press release. An explanation of these measures is also included below under the heading “Non-GAAP Financial Measures.”
During the first quarter of 2016, we repurchased $50.0 million of our common stock under our share repurchase program. During the first quarter of 2015, there were no shares repurchased under our repurchase program.
Comments
Research Reports

Projects

Latest Multimedia

Latest News


Showroom
ISO-certified Condra manufactures overhead cranes, portal cranes, cantilever cranes and crane components: hoists, drives, end-carriages, brakes and...
VISIT SHOWROOM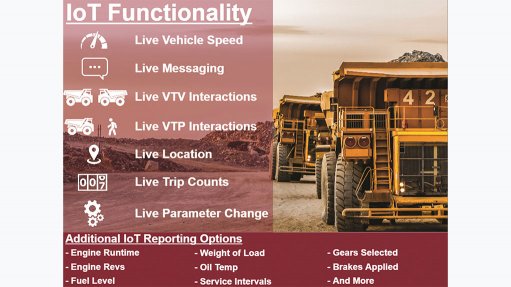
Booyco Electronics, South African pioneer of Proximity Detection Systems, offers safety solutions for underground and surface mining, quarrying,...
VISIT SHOWROOM


Press Office
Announcements
What's On
Subscribe to improve your user experience...
Option 1 (equivalent of R125 a month):
Receive a weekly copy of Creamer Media's Engineering News & Mining Weekly magazine
(print copy for those in South Africa and e-magazine for those outside of South Africa)
Receive daily email newsletters
Access to full search results
Access archive of magazine back copies
Access to Projects in Progress
Access to ONE Research Report of your choice in PDF format
Option 2 (equivalent of R375 a month):
All benefits from Option 1
PLUS
Access to Creamer Media's Research Channel Africa for ALL Research Reports, in PDF format, on various industrial and mining sectors
including Electricity; Water; Energy Transition; Hydrogen; Roads, Rail and Ports; Coal; Gold; Platinum; Battery Metals; etc.
Already a subscriber?
Forgotten your password?
Receive weekly copy of Creamer Media's Engineering News & Mining Weekly magazine (print copy for those in South Africa and e-magazine for those outside of South Africa)
➕
Recieve daily email newsletters
➕
Access to full search results
➕
Access archive of magazine back copies
➕
Access to Projects in Progress
➕
Access to ONE Research Report of your choice in PDF format
RESEARCH CHANNEL AFRICA
R4500 (equivalent of R375 a month)
SUBSCRIBEAll benefits from Option 1
➕
Access to Creamer Media's Research Channel Africa for ALL Research Reports on various industrial and mining sectors, in PDF format, including on:
Electricity
➕
Water
➕
Energy Transition
➕
Hydrogen
➕
Roads, Rail and Ports
➕
Coal
➕
Gold
➕
Platinum
➕
Battery Metals
➕
etc.
Receive all benefits from Option 1 or Option 2 delivered to numerous people at your company
➕
Multiple User names and Passwords for simultaneous log-ins
➕
Intranet integration access to all in your organisation